Why we have the dashboard
When training phishing awareness, customers often ask:
-
How are we progressing over time?
-
What types of phishing (themes/signs) are we exposed to?
-
Which groups are at risk or performing well?
-
How do we compare to others?
-
Who are the users at risk that I should keep an eye on?
The dashboard provides insights to answer these questions based on your completed phishing simulations.
How to Use the Dashboard
The dashboard allows you to explore phishing training data using filters, charts, and tables. Each section supports answering one or more of the questions above.
👉 Note: The dashboard only shows data from completed simulations.
Dashboard Filters
At the top of the dashboard, you select filters which will apply to all reports within the dashboard. Here, you can apply filters for time periods and user groups.
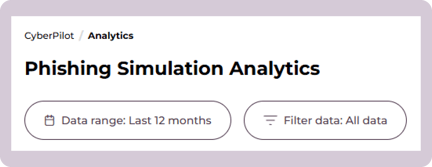
Date Range
-
Choose the time period you want to analyze.
-
Options: Last 12 months (default) or All time.
-
The entire dashboard will update based on your selection.
User Group
Break down results by organizational structure:
-
Departments (default)
-
Managers
-
Branches
-
Groups
Performance Over Time
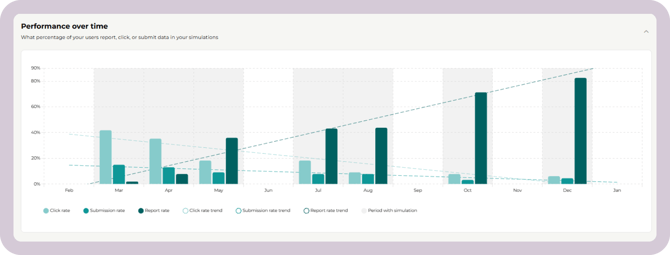
This chart shows your training progress over time.
-
Bars: Number of emails sent and interaction rates (Click, Data Submit, Report).
-
Trend lines: Dotted lines showing whether behaviors are improving or getting worse.
-
Grey shading: Periods where simulations occurred.
-
You can toggle different metrics on or off to focus on what matters most.
This view helps you spot long-term trends and measure progress.
Key Statistics
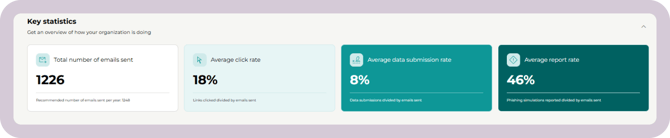
This section summarizes essential metrics:
-
Total emails sent (and suggested volume – 8x the number of users annually).
-
Average click rate
-
Average data submit rate
-
Average report rate
These stats give you a quick health check of your organization’s performance.
Phishing Analysis
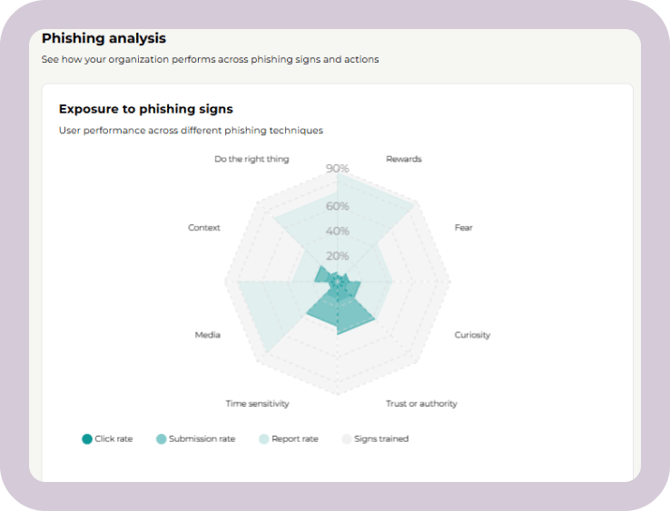
Exposure to Phishing Signs
-
See which phishing signs/themes were included in training.
-
Review how users performed on each sign.
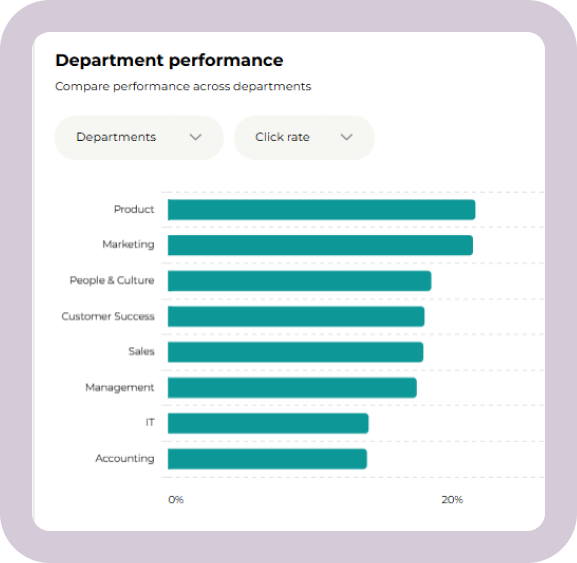
Department (or Group) Performance
-
Compare results across your chosen grouping (Departments, Managers, Branches, or Groups).
-
Spot which areas need extra focus and which are performing strongly.
Simulations
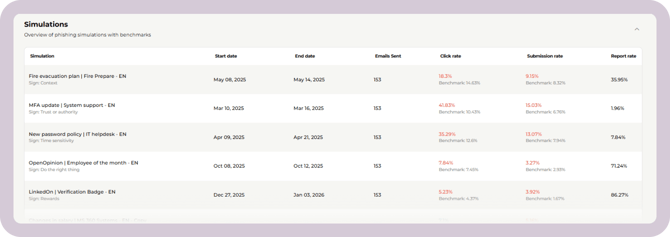
This table provides detailed information about each simulation within the selected period:
-
Simulation name and phishing sign
-
Start and end dates
-
Number of emails sent
-
Click rate (with benchmark)
-
Data submit rate (with benchmark)
-
Report rate
This helps you analyze individual simulations and compare them against benchmarks.
✅ By using these features together, you can track progress, benchmark results, and identify where to focus your phishing training next.