The purpose of the dashboard is to give you, as an administrator, a clear starting point for understanding your organization’s overall security activity on the CyberPilot platform. It brings together the most important trends and risk indicators in one place, so you can quickly see how your security efforts are developing over time — without switching between multiple reports.
The dashboard is designed to help you identify trends rather than evaluate single events. Focus on development over time: Are behaviors improving? Is engagement stable? Are risks increasing?
When you need deeper insights, you can click through to the product-specific analytics pages for Awareness, Phishing, or Security Culture to explore the underlying data in more detail. This guide explains what each section shows, what to look for, and how to act on the insights.
Why the dashboard may look different
We continuously improve the dashboard experience to make it clearer, more actionable, and easier to use. As part of this process, some reports have been refined, relocated, or replaced to ensure that the dashboard focuses on overall trends rather than operational details.
The goal is to reduce complexity while still giving you the insights you need to identify risks, monitor engagement, and understand development over time. If you are missing specific insights or have suggestions for improvements to the dashboard, we would love to hear from you.
You can reach out to your Customer Success Manager, use the chat in the CyberPilot platform, or contact us at support@cyberpilot.io.
Sections in the Dashboard:
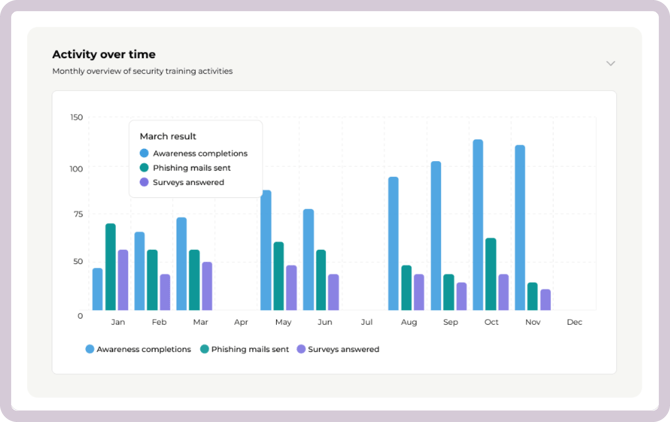
Activity over time
This bar chart shows your organization’s monthly activity across all three CyberPilot learning products:
-
Awareness completions — trainings completed that month
-
Phishing emails sent — simulated phishing emails delivered
-
Surveys answered — security culture responses submitted
What to look for
-
Is activity stable or increasing over time?
-
Are there sudden drops in completions, simulations, or survey responses?
-
Are spikes aligned with campaigns, enrollments, or internal initiatives?
What changes may indicate
-
Falling activity may signal lower engagement, fewer assignments, or lack of internal communication.
-
Increased activity may reflect new enrollments, awareness campaigns, or stronger internal focus.
What to do
If activity changes significantly, consider:
-
Have new users been added or removed?
-
Have users recently been enrolled in training?
-
Have you launched new simulations or surveys?
-
Has internal communication around security changed?
If needed, click into the relevant analytics page to explore the underlying drivers in more detail.
Awareness Training
Awareness training helps users build secure habits through short, continuous learning. The goal is to strengthen secure behavior in everyday work.
The Awareness section shows whether employees are completing training, falling behind, or not engaging at all.
1. Quick overview
At the top of the Awareness section, you get a snapshot of where your organization stands right now:
-
Training completions – How much of the enrolled training has been completed.
-
Training content – How much of the available training is currently in use.
-
User completion – How many users have completed all their assigned training, out of the total number of enrolled users.
-
Overdue users – How many users currently have training past the due date.

Use these numbers as a starting point. If completion is low, engagement may need attention. If overdue users are increasing, follow-up or reminders may be needed.
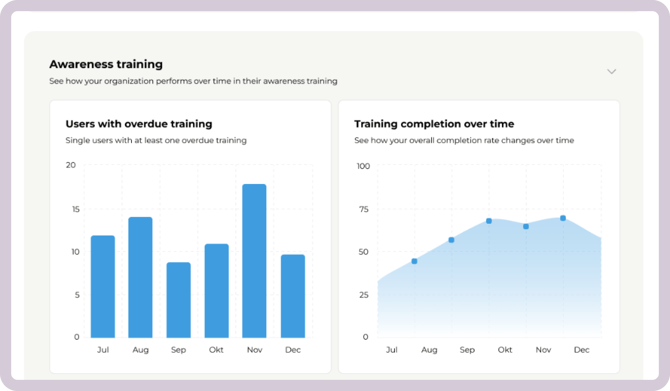
2. Users with overdue training
This chart shows how many users had at least one overdue training at the end of each month.
What to look for
-
Is the number of overdue users increasing month over month?
-
Does it spike after enrolling new users?
What it may indicate
-
Increasing overdue training may suggest reminder settings need adjustment.
-
It may also indicate that training volume is too high or poorly communicated.
What to do
-
Click the chart to identify specific users.
-
Send reminders or review communication.
-
Check your training settings under Account if reminders need to be adjusted.
-
Ensure new users understand expectations from the start.
3. Completion rate over time
Shows the cumulative completion rate for all assigned awareness training at the end of each month:
-
Trainings completed
-
All trainings assigned up to that month
What to look for
-
Is the completion rate steadily increasing?
-
Does it slow down after new enrollments?
-
Does it improve after reminders or internal communication?
What it may indicate
-
A stable upward trend suggests healthy engagement.
-
A flattening curve may indicate reduced motivation or unclear expectations.
What to do
-
Reinforce internal communication around training.
-
Review enrollment timing and volume.
-
Use the trend as documentation when reporting progress to management.
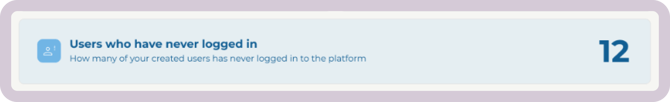
4. Users who have never logged in
Displays the number of users who have assigned training but have never logged into the platform.
What to look for
-
Is the number stable, increasing, or decreasing?
-
Are these primarily new users?
What it may indicate
-
Users may not have received login information.
-
Internal onboarding may not clearly explain training expectations.
What to do
-
Click the banner to identify affected users.
-
Follow up with the users to figure out why they're not logging in.
-
Ensure awareness training is introduced clearly as part of onboarding.
Phishing
Phishing training measures how users react to realistic phishing emails and helps identify risky behavior in a controlled environment.
The Phishing section highlights performance trends and identifies users who may need additional support.
1: Active phishing simulation
This section shows whether a phishing simulation is currently active in your organization.
If a simulation is running, you will see:
-
The simulation name
-
Current status (e.g., started, in progress, completion date)
If no simulation is currently running, the dashboard will instead show:
-
The next scheduled simulation, or
-
A prompt to create a new simulation if none are planned
What to look for
-
Is a simulation currently running?
-
When will it be completed?
-
Are there upcoming simulations scheduled?
What it may indicate
-
An active simulation means users are currently being tested and results are being generated
-
No active or scheduled simulations may indicate gaps in your phishing training plan
What to do
-
Click the section to go directly to the simulation and monitor progress
-
If no simulation is running, consider scheduling one to maintain continuous awareness
-
Use this section as a quick daily check to understand what is happening right now
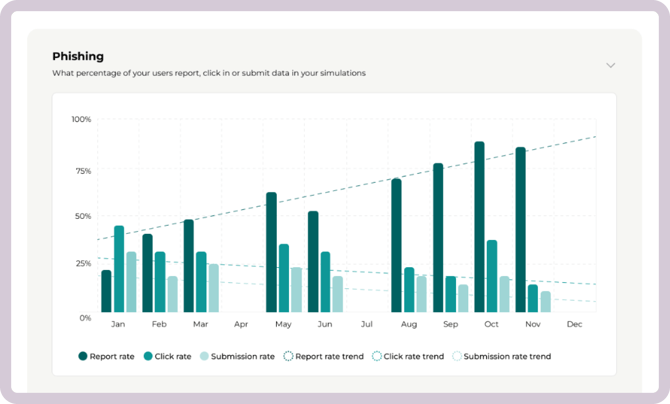
2. Performance over time
Shows click rate, submission rate, and report rate with trend lines.
-
Click rate - clicked the link in the phishing simulation
-
Submission rate - entered information after clicking
-
Report rate - correctly reported the email
What healthy development looks like
-
Click rate decreasing over time
-
Submission rate decreasing
-
Report rate increasing
Warning signs
-
Click rate increasing after a period of improvement
-
Submission rate remaining stable or rising
-
Report rate declining
What to do
-
Review simulation frequency and difficulty.
-
Reinforce phishing awareness internally.
-
Consider targeted follow-up for specific groups.
-
Look for patterns after holidays, staff changes, or new campaigns.
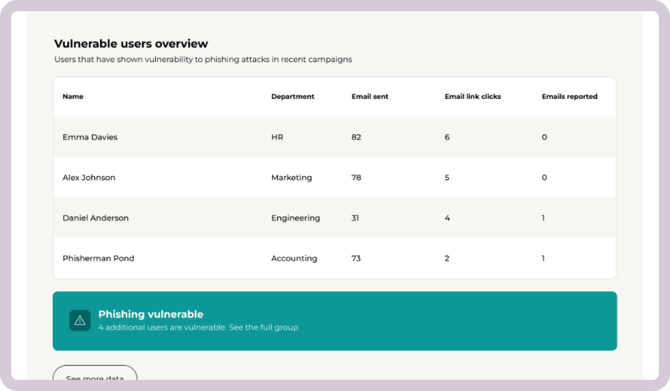
3. Vulnerable (Risky) Users
This section highlights users currently considered vulnerable in phishing simulations.
Users enter the group after clicking or submitting data in a simulation and are removed after passing two simulations in a row.
What to look for
-
Is the vulnerable group growing or shrinking?
-
Are the same users repeatedly appearing?
What to do
-
Prioritize follow-up training for vulnerable users.
-
Use the “See full list” link to plan targeted communication.
-
Monitor whether targeted follow-up reduces risk over time.
To explore phishing results in more detail:
Visit the Phishing Analytics dashboard here.
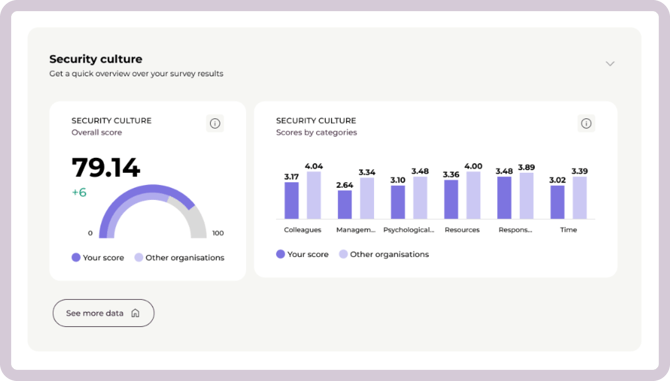
Security Culture
Security culture measures how employees think and act around security in everyday situations.
The dashboard provides both an overall score and category-level insights.
1. Overall Score
A gauge visualization showing your organization’s current security culture rating.
What to look for
-
Is the score improving over time?
-
Does it change significantly after initiatives?
What it may indicate
-
Gradual improvement suggests cultural development.
-
A lower score may indicate gaps in awareness, responsibility, or management support.
What to do
-
Use the score to guide leadership discussions.
-
Track development after awareness campaigns or internal initiatives.
2. Scores by Category
Shows how your organization performs across cultural dimensions.
What to look for
-
Are certain categories consistently lower?
-
Are gaps widening or narrowing over time?
What to do
-
Identify specific focus areas (e.g., psychological safety, responsibility).
-
Use insights to design targeted internal improvements.
-
Compare results across periods to measure progress.
Best practice: Monthly dashboard review
We recommend reviewing the dashboard once per month as part of your security routine. A consistent review helps you detect early warning signs, document progress, and keep security visible in your organization.
1. Start with Activity over time
-
Has overall activity increased or decreased?
-
Were there fewer completions, simulations, or survey responses than last period?
-
Did any major internal changes (new hires, holidays, campaigns) influence activity?
If activity drops unexpectedly, review the relevant analytics page to identify whether the change is driven by participation, assignments, or engagement.
2. Review Awareness indicators
-
Is overdue training increasing?
-
Is the completion rate developing as expected?
-
Are there users who have never logged in?
If overdue training grows or completion slows down, consider adjusting reminders, reviewing training settings under Account, or strengthening internal communication.
3. Review Phishing trends
-
Is click rate improving over time?
-
Are submission rates decreasing?
-
Is the vulnerable user group growing or shrinking?
If risky behavior increases, consider targeted follow-up training or internal communication.
4. Check Security Culture development
-
Has the overall score changed?
-
Are certain categories consistently lower than others?
-
Are there areas that require management attention?
Use these insights to guide leadership discussions and long-term security initiatives.